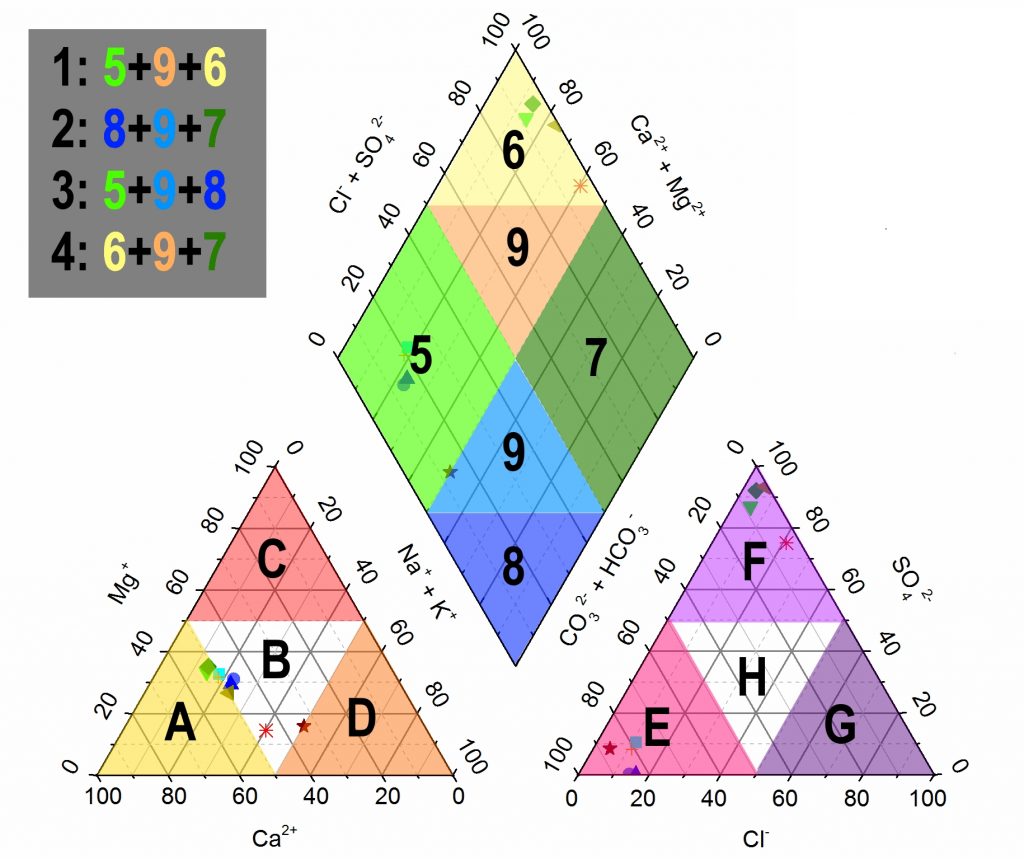
The cations and anions are shown by separate ternary plots. The apexes of the cation plot are calcium, magnesium and sodium plus potassium cations. The apexes of the anion plot are sulfate, chloride and carbonate plus hydrogen carbonate anions. The two ternary plots are then projected onto a diamond.[2] The diamond is a matrix transformation of a graph of the anions (sulfate + chloride/ total anions) and cations (sodium + potassium/total cations).
Piper diagram