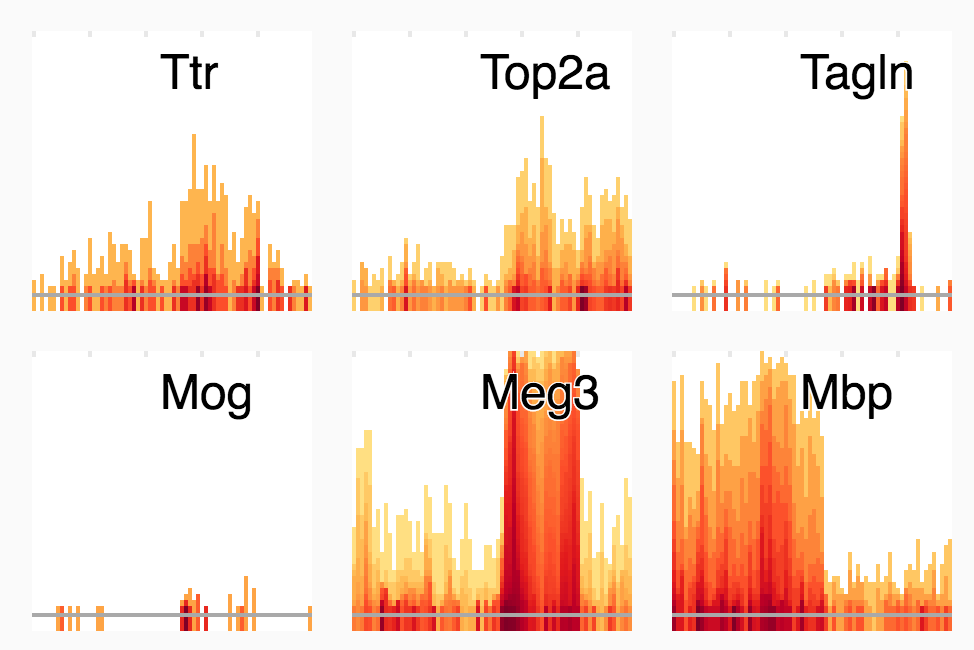
Icicle and flame maps are a novel type of plot to cope with issues that arose due to having far more raw data to show than available screen resolution. Specifically, they avoid issues of smoothing out information through averaging. In a flame map, the “height” of a column shows the ratio of zero to non-zero values in that column. The heat map gradient of the column shows the actual values.
Flame map