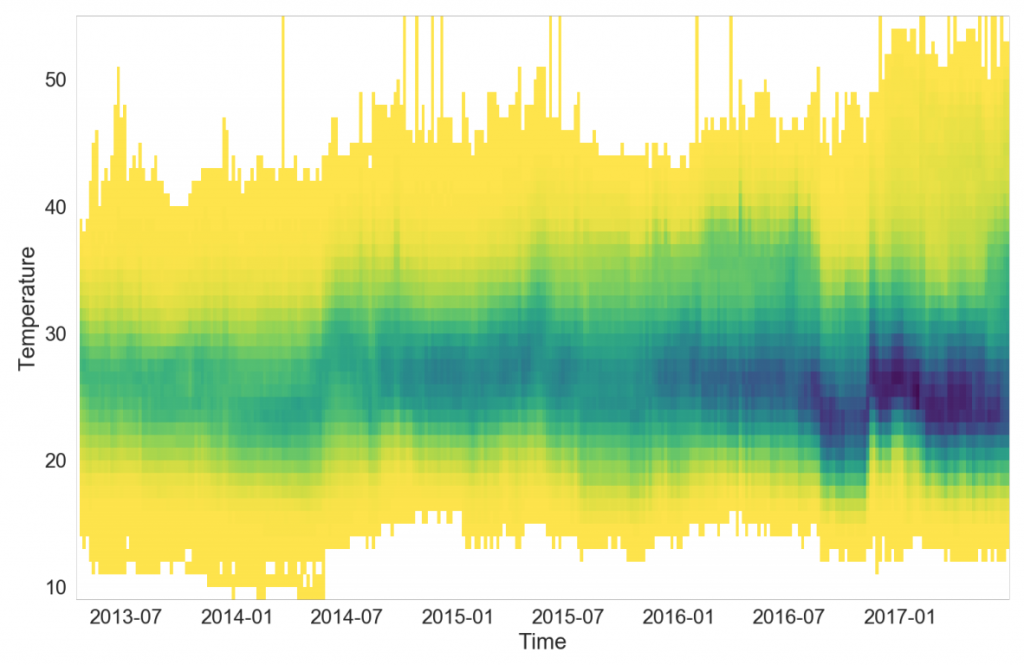
A density representation of many time series as a heatmap. In DenseLines the density is the number of lines that go through a particular bin. The densities are normalized by the arc length of each time series drawn as a line to compute accurate densities. The derived density visualization allows users both to see the aggregate trends of multiple series and to identify anomalous extrema.
